Plotting alignment vertical profile and cant in Bonsai

Using @Jakob 's bonsaiGraph as inspiration, I've created a simple add-in for bonsai to plot alignment vertical profile and cant.
A screenshot showing the add-in, in action, for a railway alignment.
If you want to play around with this, here is the repo. https://github.com/RickBrice/alignmentPlot
There is probably a better way to do this, but you've got to start somewhere. One big problem is the plots are static images. There is no way to edit the alignment, profile, or cant.
I'm open to suggestions to make this more functional.


Comments
@Rick_Brice
nice feature that opens to many possibilities
any chance we can somehow model an alignment/profile in Bonsai based on a csv or similar?
I noticed the option in the menu but its implementation is a bit unclear for me at the moment.
Thanks for your efforts, truly appreciated
Rick has done a great job of including documentation for create_from_csv.
IIRC horizontal is currently limited to lines and circular arcs. Vertical is limited to constant grades and parabolic vertical curves. No support for clothoid transitions or cant ATM. PRs welcome ;-)
Importing alignment from CSV is straightforward, but it has its limitations.
Documentation is here:
https://docs.bonsaibim.org/guides/alignment.html
The first row in the CSV is a sequence of X, Y, Radius for a horizontal layout. The first and last radii are placeholders so just input zero.
The second and subsequent rows in the CSV is a sequence of "Distance Along Horizontal to PVI", "PVI Elevation", "Horizontal Length of Parabolic Vertical Curve". The first and last parabolic curve length are placeholders so just input zero.
Attached is an example input file based on and alignment defined in the US FHWA Bridge Geometry Manual.
https://rosap.ntl.bts.gov/view/dot/62673
Horizontal layout is limited to circular curves. Vertical layout is limited to parabolic vertical curves. No spiral transitions. No cant.
@Rick_Brice traditionally most authoring tools have handled this by placing the graphics for vertical alignment in plan view far enough away from the actual project that graphics do not overlap. Oftentimes there is some metadata left behind on the graphics to correlate the Global XY of its placement to the corresponding station/elevation of the profile. It would also need to include information on the corresponding horizontal layout / IfcCompositeCurve as well as the horizontal and vertical scales. Perhaps this could be persisted in Native IFC via GeometricRepresentationSubContext(s) ??
@Rick_Brice
I imported the .csv and this is the output (all IfcReferent fall on the same 0,0 point)
View settings to 1000000m to prevent the cutting
is it the same at your end?
thanks
@steverugi my apologies - it looks like I have broken something. I now get the same results as you.
I will work to fix this as soon as possible.
@steverugi I got the bug fixed. When reading the CSV value, I assumed the IFC project had plan angle measure in radians. The default for a bonsai project is degree. This made the direction of the start point for each segment incorrect.
The fix should filter through the daily build process soon.
In the meantime, change the angle measure to radian before importing the CSV file and you should get the right horizontal alignment.
@civilx64
Perhaps - I have some learning to do with representation contexts and subcontexts. They are a bit of a mystery to me at the moment.
In the IFCOS api, there are two ways to get the geometry of an IfcGradientCurve, One is as a 3D curve and the other is as a 2D curve in "x = Distance Along Horizontal", "y = Elevation" coordinates. This would easily plot on the XY plane, same as the horizontal.
@Rick_Brice
Looks much better now, thanks for the quick update
when you have a minute:
1. Are all IfcReferent points supposed to be on 0,0,0?
2. by looking at the webpage :
and your csv:
If you don't mind, I (and my colleague Jonathan, a road/rail Eng.) would personally see more practical if the csv were transposed vertically, that is, having the first 3 columns with X,Y,R for the horizontal alignment and further columns for the vertical one with D,Z,L or multiple
like:
I have no idea about the csv parsing implications so I guess if that is not feasible the format can be changed before being processed (or a "transpose" checkbox added to the import panel )
Thanks again for your efforts, having alignment implemented in our IFC4x3 projects is a game-changer for infrastructure works, maybe Bonsai won't be a Civil3D competitor anytime soon but many things could be progressively introduced step by step
...after all it just turned 6 years old and I have a feeling that the enfant prodige of the AEC industry has a promising future ahead.
cheers
@Rick_Brice
here a quick script (test = OK) to rearrange the .csv from horizontal to vertical with column headers, multiple vertical profiles affect the numbering of column D, Z, L (credit to Grok)
output:
@Rick_Brice
here the "untransposed" version (Test = OK) from column back to by-row arrangement
output of the previous .csv
thanks again for everything
cheers
PS the import panel might need to factor if units are in feet or meter?
Thanks for the suggestion. I'll take at look at the details. I'm not married to the CSV format.
They are not supposed to be at (0,0,0). I don't know what is going wrong. After the alignment is created from CSV and the IFC objects are mapped to blender objects, I dump the linear placement information and the fallback coordinates, and they are not at (0,0). I may need to enlist the help of advanced developers to help me figure that out.
Thanks for implementing the graph vis into it and for continuous work on IfcAlignment @Rick_Brice!
One idea I had was to try and implement graph-based alignment components (vert profile, cant, etc) into the Graph Editor:
https://docs.blender.org/manual/en/latest/editors/graph_editor/introduction.html#main-region
Some of the graphs would be read-only (terrain), but some could potentially be modified using most of the curve editing functionality available there. I bet current frame location can be synchronised with some element moving along the alignment (Vertical plane for example).
Frames == Chainages.
It can also visualise parameters change along the alignment (road widenings etc).
Happy to go into a 🐇 hole or two to explore it further. Any pointers would be much appreciated.
@valbelets I was thinking the same thing but really have no idea where to begin.
I can give you some pointers about the alignment geometry and segments. It's probably better to answer specific questions when you have them.
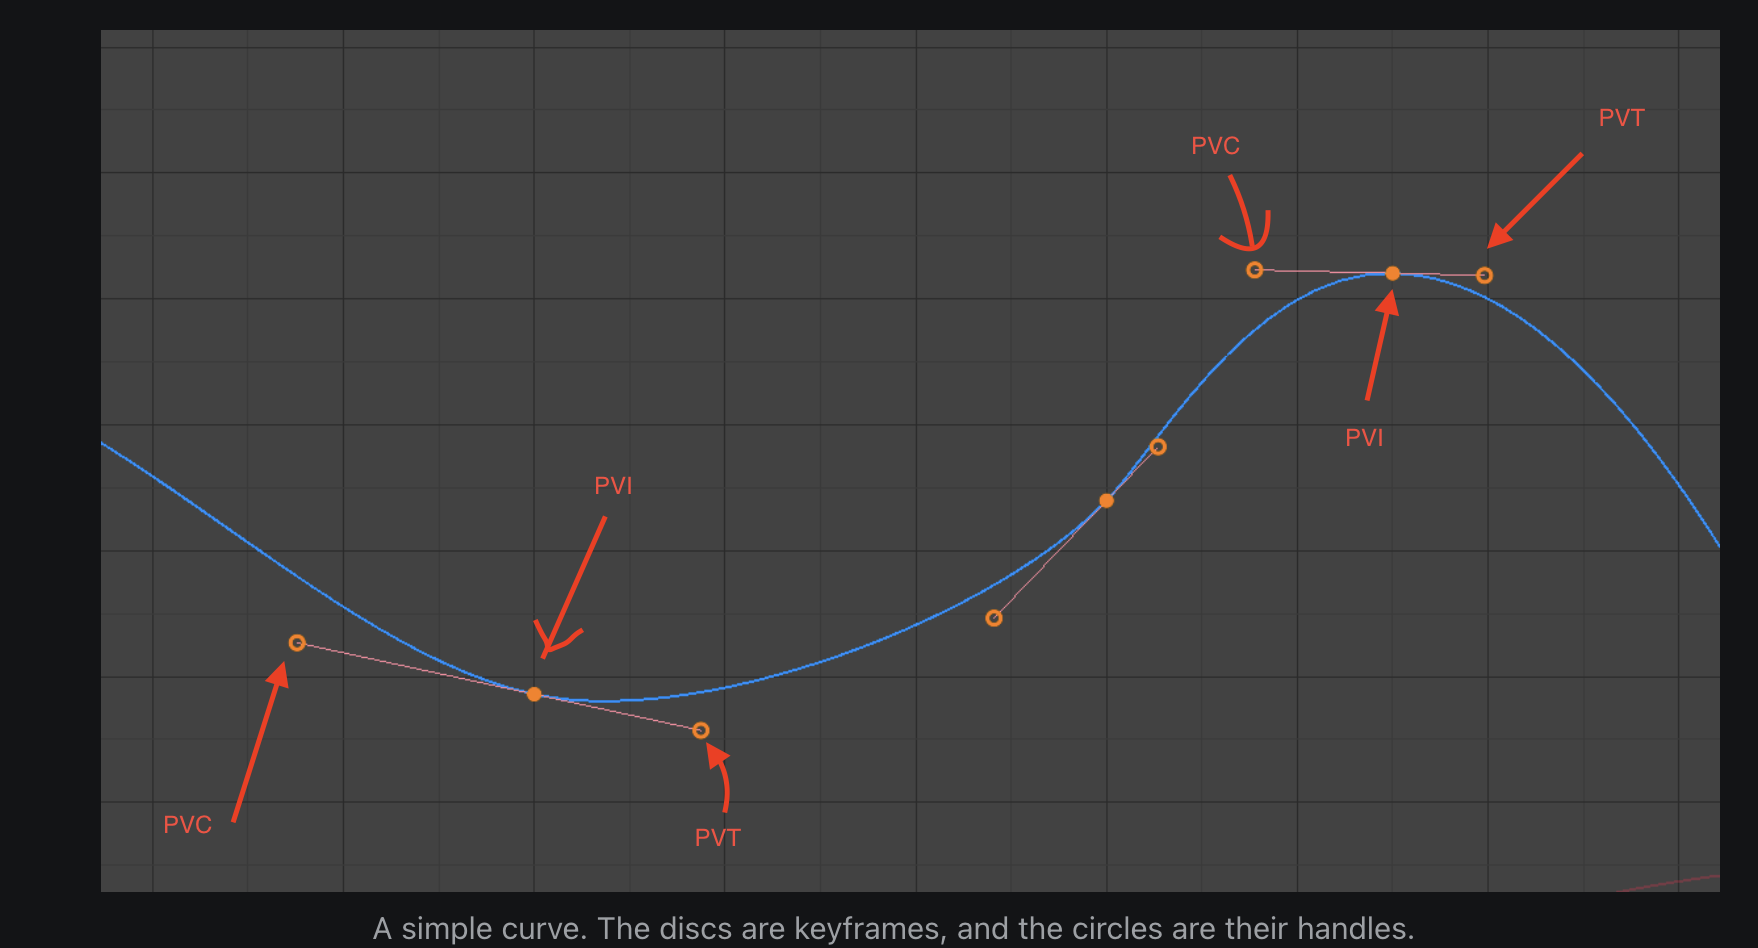
You could load the vertical layout from the business logic and then use the center circle to edit the PVI station and elevation, with the other two circles corresponding to the beginning and end of the vertical curve. After the user finishes editing the business logic, the representation is re-calculated from it. The UI would maybe look something like this: