BBIM - Pile layout plan, custom symbols, symbols & 3D elements, schedule
Hey everyone,
It's been some time but after graduating I'm back :) For this project I want to create a similar pile layout plan like this:
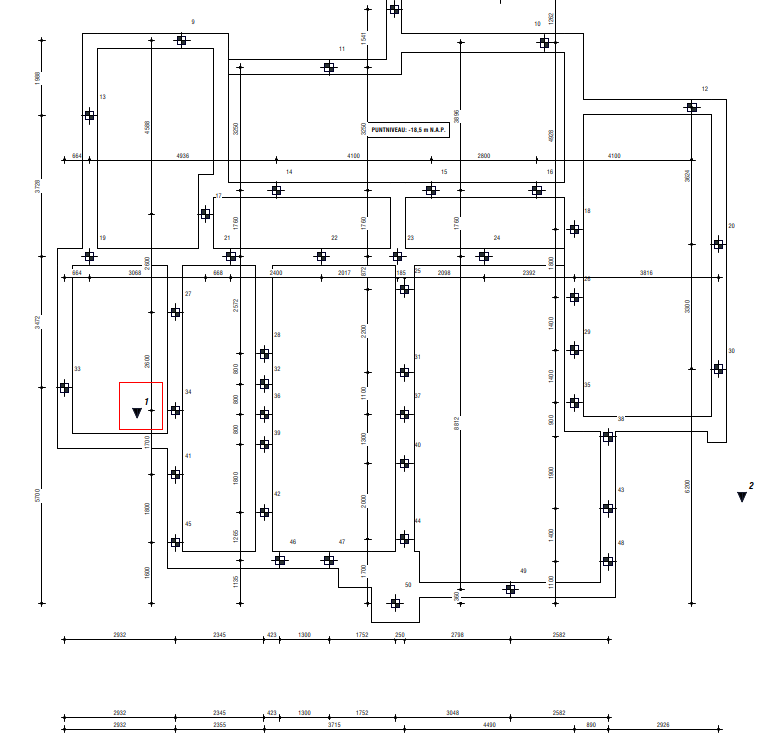
Therefore I made a simpler test:
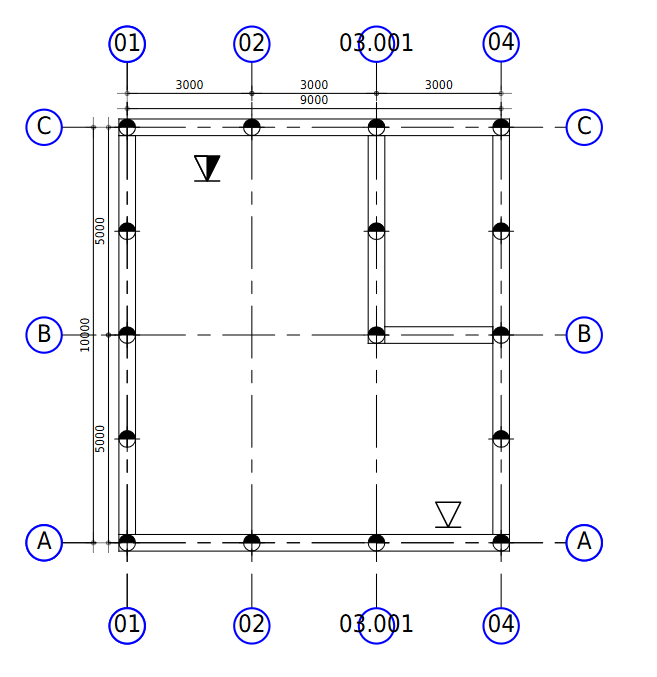
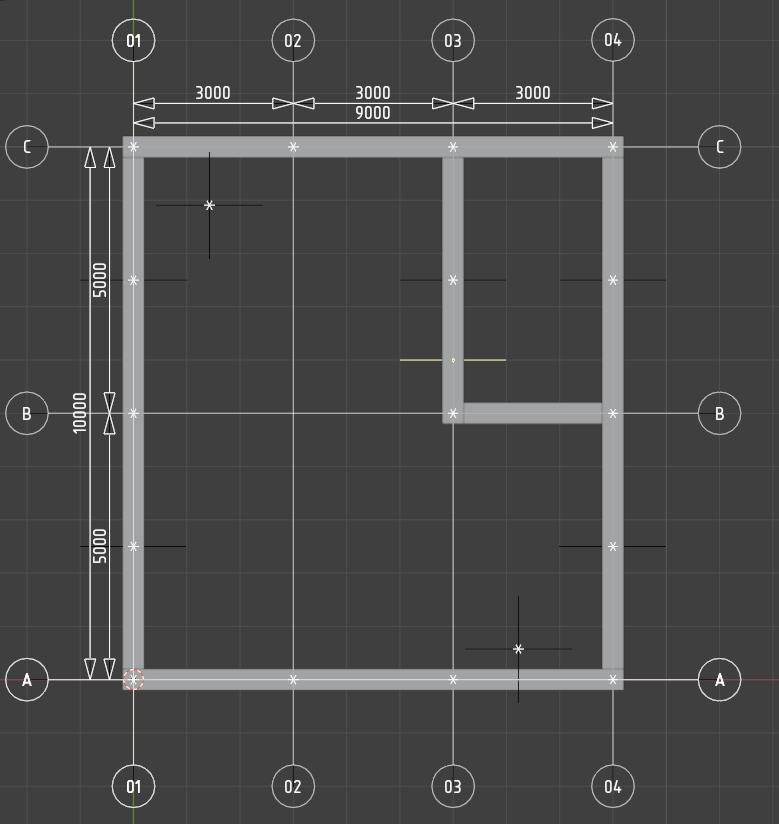
Some questions / errors / bugs I came about:
1. Grids still don't work as intended. Numbering is off, like grid 3 in viewport being just 3 and in print 3.001; Anybody have the same issue and knows how to fix it? The placement of the 3D grids is also still not working: not saving after changes to position. When reopening the file they are back to the first position.
Is it possible to link an symbol to a 3D element? In the ideal situation the symbol would get placed simultaniously and would move with the element. I tried parenting, nesting and aggregate but it wouldn't let me. There is also no EPset_Annotation possible, which would be the most simple solution I think. I also tried using a Model/Annotation/PLAN_VIEW representation as symbol for the pile so the 'symbol' would move, but I think it's technically not the best and not the preffered workflow (if you want to change symbol, or it doesn't show up because of export order etc.) An advantage of this method is that the 'symbol' doesn't scale with the view scale. This might be preferred sometimes, or is that possible too with a normal symbol?
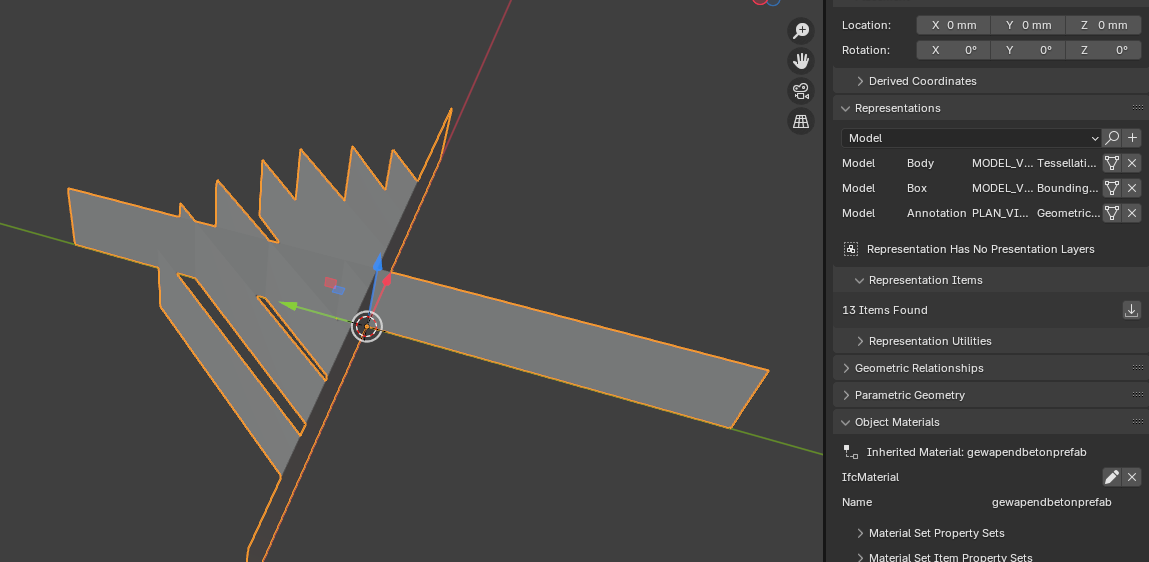

Projects with the Ifc4x3 schema have double work with annotations: Placed annotations are given a PredifinedType but for bonsai to work you need the ObjectType (text is not visible, only origin with just the PredifinedType). Wouldn't it be better if the (untyped) annotations worked directly with the PredefinedType without having to type in the ObjectType too? In this example TEXT.
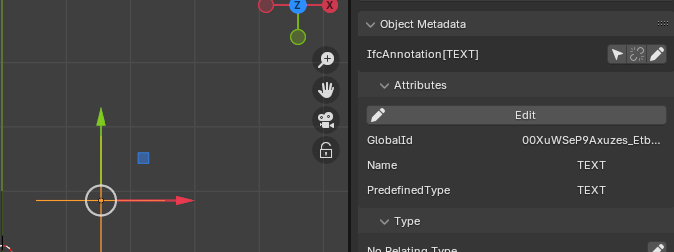
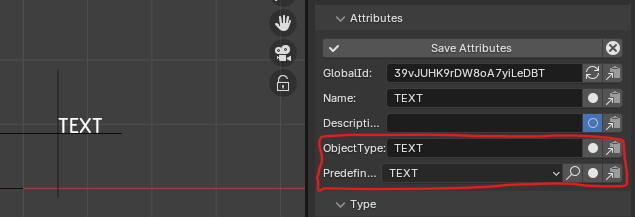
What is the correct way of making custom Psets? If for example I want to add 'Cutting height' to a pile I choose Custom_Pset, click the + but then I can only input the string as value (or a number, but not relevant in this case). As you can see the 'StringProperty' isn't changeable, which is needed if I want 'Cutting height' and then the actual value.

I think this isn't how it supposed to be

- If I want to make a legend like the one below, how would you do it? I know how to make a basic costing schedule, but not something like this (symbol, how many piles, length, cutting height etc.)

Many thanks in advance!


Comments
hi @jes_r
create a new one from custom_pset in the Project Overview panel
(which is a better practice than using one on-the-fly available in Object Metadata > Property Sets in my opininon)
hope it helps, cheers
apart from the symbol, are those values from quantity take-off in Bonsai or you manually typed them in a custom quantity set?
in any case it would be easier to help if you could share your model to understand where those figures come from, cheers
looking good!
If grid 3 is the only 3, then rename it and see if it still prints as 3.001, it was most likely a copy of the original 3 or vice versa at some point
The latter might be a bug, I'd say post it on Github!
I do it the same way you do at the moment, hopefully in the future, we can get a representation of annotations that are more directly editable in the UI
Not sure but I think they play different roles, I'm sure you can hide the Object type from the user but it's related to being compliant with IFC for interoperability
Thanks for the reply, didn't know that option!
This is just an example, whereas I don't have any experience in custom quantity sets. Ideally I would perform a quantity takeoff where other criteria (like amount/count) are also calculated and displayed.
As said above, these figures aren't from this IFC file, but from Revit. But here is the model. Note that it's just a test so I haven't placed all piles, but how would you make a legend in which the result would be: 'symbol', 'count: 2' (calculated), 'length: 5000 , 'cutting height: 1000' (custom property, both are in mm and data from quantity takeoff)
And would it be possible to let Bonsai calculate the values of the custom properties? I guess that would need Python or would it be simpler?
Length
once you run Quantity take-off on selected items
you can get their (for instance) length using the following query in Quality and Coordination > Collaboration > Spreadsheet Import/Export
in
/Qto_.*BaseQuantities/.Lengththe.*and slashes are needed because you have both IfcPile and IfcBeam in your model, filtered as IfcBuildingElement (if you use 4x3 change it to IfcBuiltElement)output
to give you an example of how to use custom pset I also added it as last property in the query, does it help?
This worked now, but I really thought I already tried that yesterday ;) Might be my own fault then or because of the restart. Thanks!
So you create the 3D element, then the symbol in symbol.svg and place/move it manually apart from the 3D object?
Ah okay thanks, I just noticed it because yesterday that option gave me all kind of warnings/bugs in IFC4x3. So I switched to 4x0, but this morning the same was fine in 4x3.
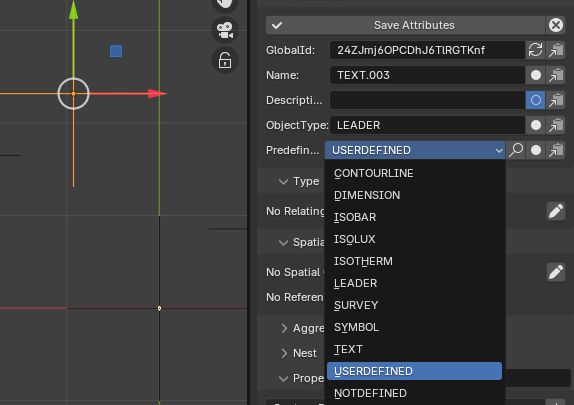
Predefined Type isn't visible in 4x0 and in 4x3 you can add eg. a Text annotation, which then shows nothing as you have to type in 'TEXT' in ObjectType. From PredefinedType you can also choose other annotations, like 'LEADER'. Changing to this does nothing and filling 'LEADER' in the ObjectType also does nothing. Seems peculiar as if PredifinedType being visible might be a bug.

Thanks a lot! This helps for sure! I dont have any programming experience so these parts scare me a bit ;)
guess what: me neither!
fear not, it will be a bit bumpy sometimes but totally worth the trip
counting
generates
the third column of the query groups the output on
type.Nameandcountshows the total occurences for each typeI actually don't use the symbol, I create a 3D element with a Plan view so that I can move the 3d object, thes fastest method at the moment for me, and then you can arbitrarily edit the 2d representation
Might be, If you think so definitely post as a bug
if you need to, turn on the 'screen' item to make types visible or not
Ah I misunderstood. So you have all black symbols? And how do you make a fill (yellow marker)? And if for example a concrete beam (black dashed lines) is above the pile with the 'symbol', does the 'symbol' ( model/Annotation/PLAN_VIEW) still print on top?

Haha yes I'll try!
Amazing! I finally begin to understand how it works. Do you know of any table in which the possible query's are summed up/explained? That would help very much!
At the moment most of my symbols are black, I think the trick I used (as a work around) was setting a color for a specific IfcClass, I can't remember at the moment, but I did have a few red 2d objects.
If you use a plan representation the height of the 3d object is tied to the height of the representation so if you want it to be above, you move the object above physically
see if the content of this shared Dropbox folder can help you out
inside there is an .xlsx file with the queries and all .json files that can be used to be imported in Bonsai, please let me know if you see some other query that could be of use
cheers
@steverugi Thank you! This is great!
could you do a reflected ceiling plan instead, to show the piles? Unfortunately grids don't show in reflected ceiling plans, however.
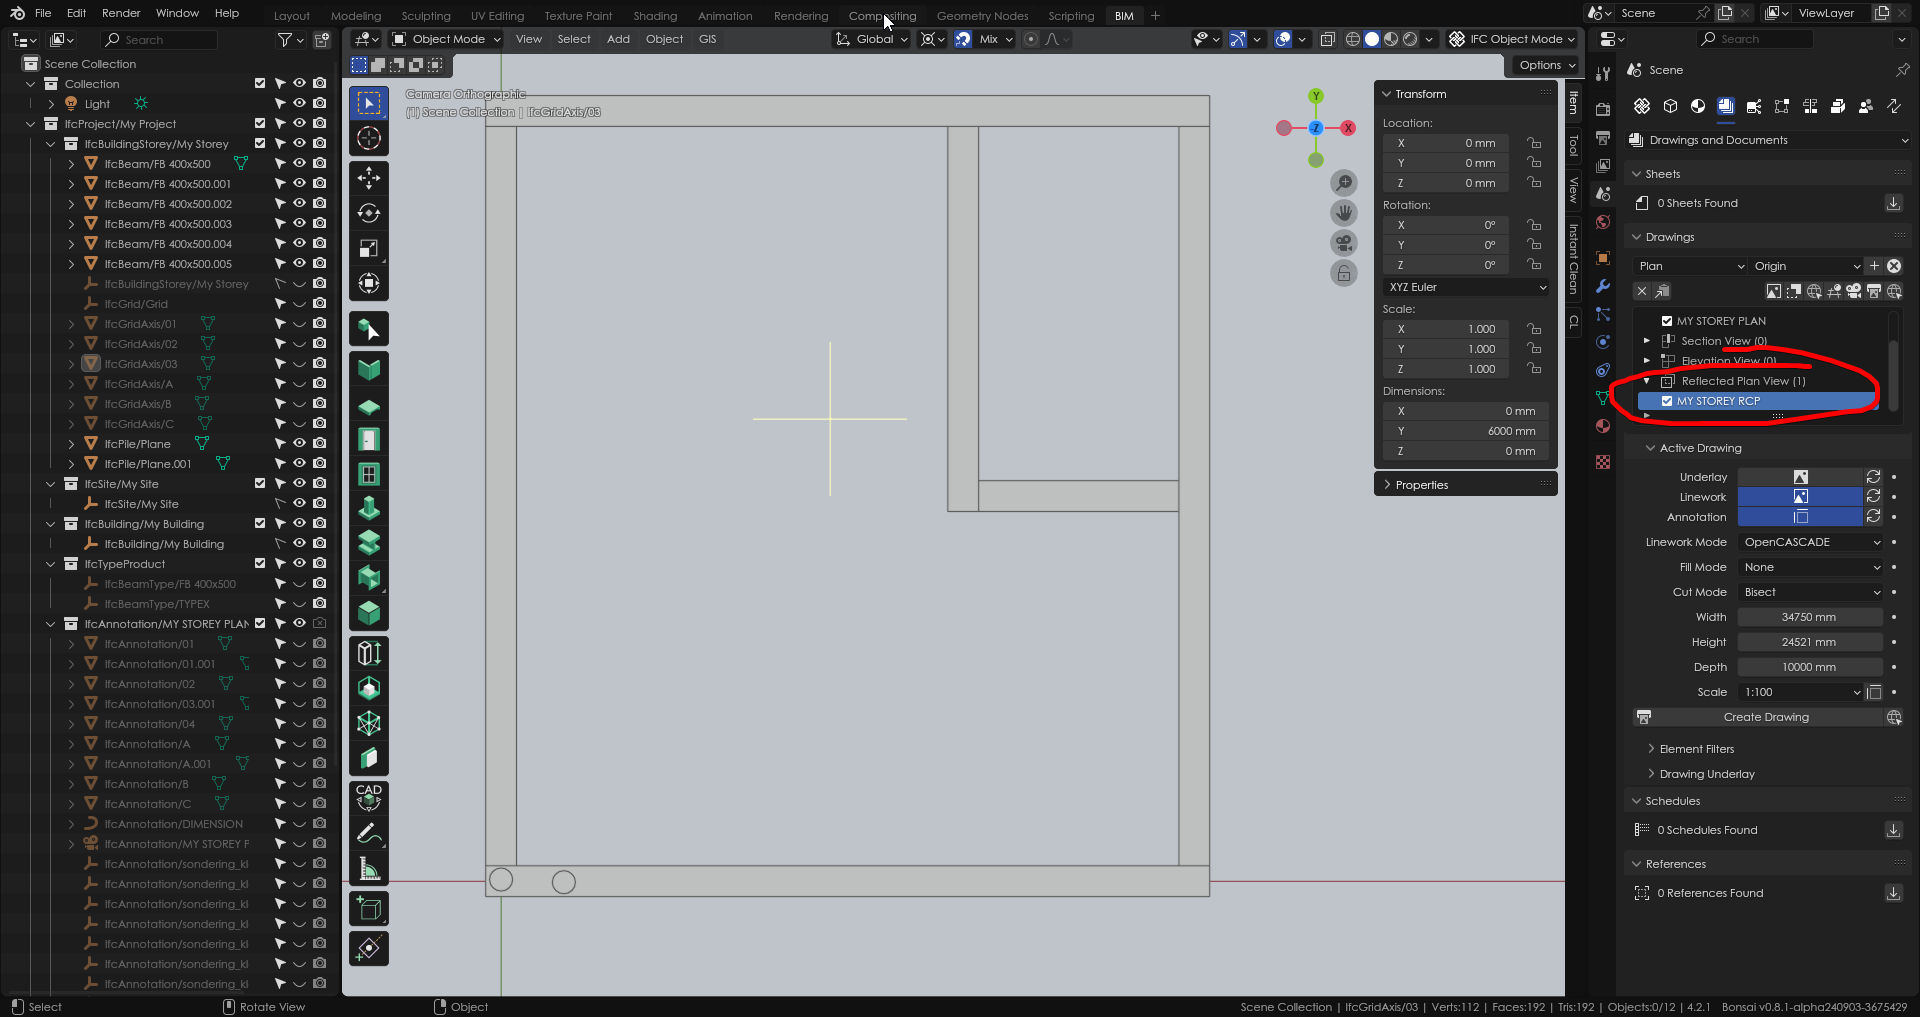
Grids, in general, have been broken for me for some time: https://github.com/IfcOpenShell/IfcOpenShell/issues?q=sort:updated-desc+IfcGridAxis+author:theoryshaw+is:open
...
When you move grids around, make sure to move the
IfcGridAxis, not necessarily the 'IfcAnnotation` associated with it.Did it, as I got the error/bug again.
For those interested: https://github.com/IfcOpenShell/IfcOpenShell/issues/5314
Yes great idea! Grids don't really matter in this situation, so I'll try this in combination with representation 'symbols'.
Yes that works, but when you save and reload IFC they went back in the corner for me ;)
Yeah, i think grids are still borked a little.
Here's our workaround
video: https://community.osarch.org/uploads/editor/a2/flktdf1zg8zk.mp4
Yeah I think this would be the best for now, the least errors. I had some trouble copying annotations to other views half a year back, is there a way that works right now?
Could this be the same reason the representation 'symbol' made with Model/Annotation/PLAN_VIEW doesn't show up? When I open the RCP and let it print I just get this:
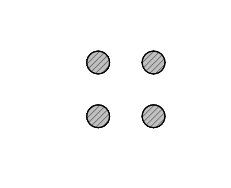
When I manually activate the Annotation representation with the symbol in it it gives me this:

So still no symbols like in the normal floor plan. I made every represenation on a different height so that wouldn't be the problem:
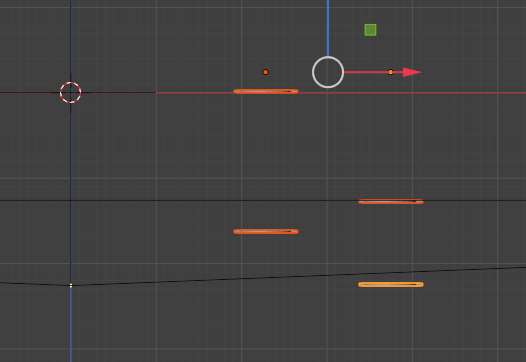
After printing they are back to normal model body representation, so this
Wouldn't be a permanent solution either way.
Update:
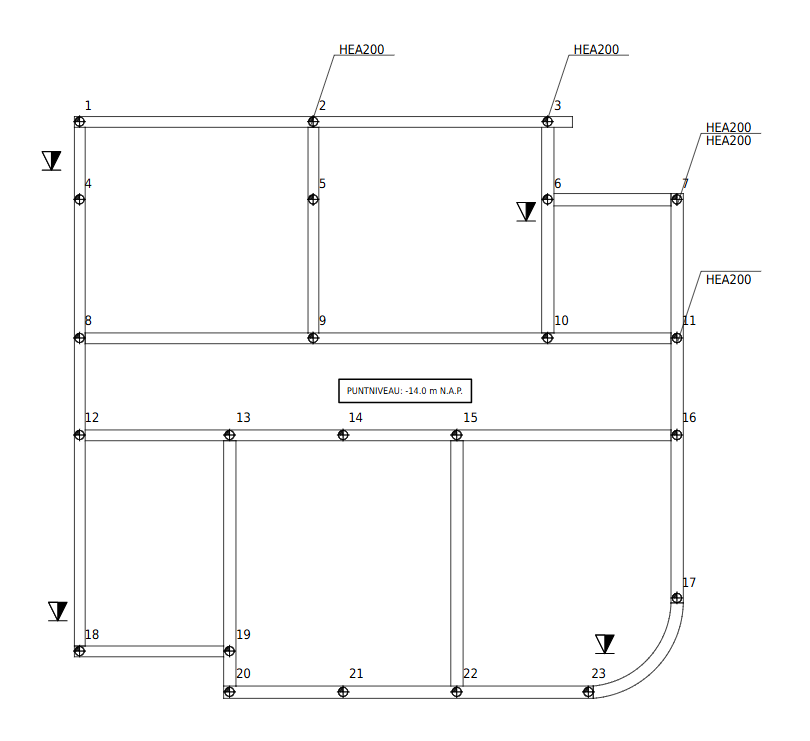
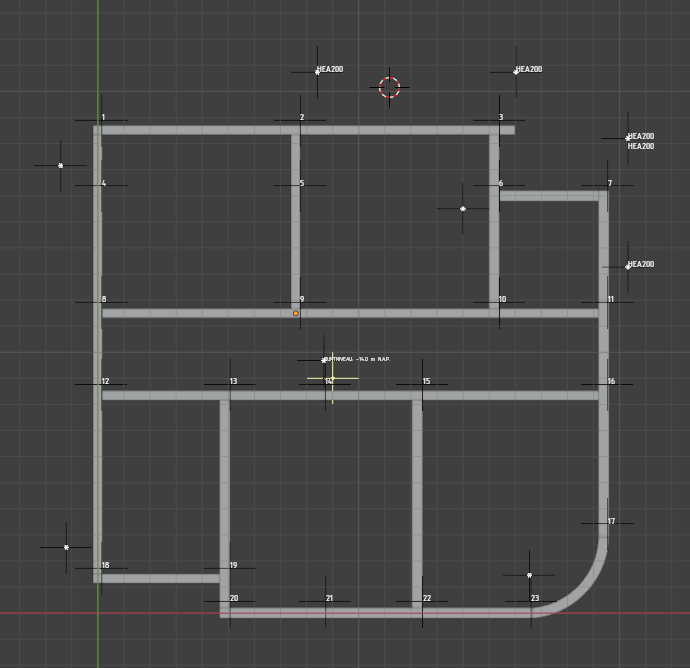

For now I made this Pile layout plan and schedule (big thanks to @steverugi ) and will share how I made it. Perhaps someone knows a better way or learns something!
Structure:
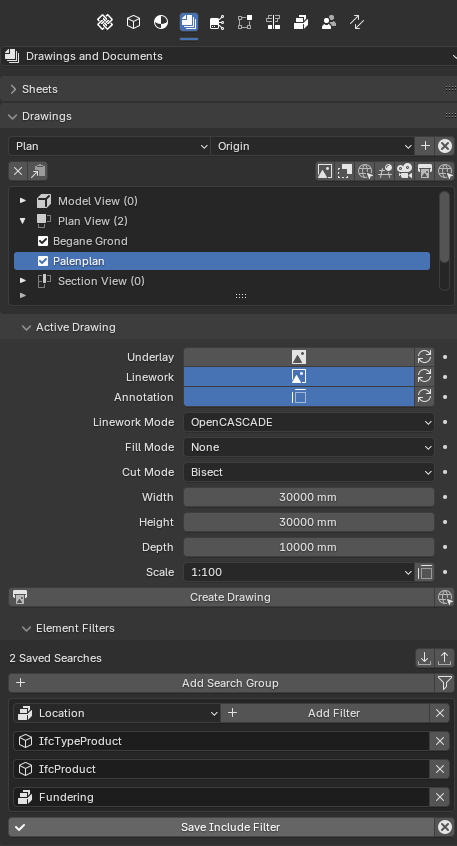
Normal plan view with filter settings, so that only elements on the foundation level are included (Include Filter: Location>"Fundering" in this case).
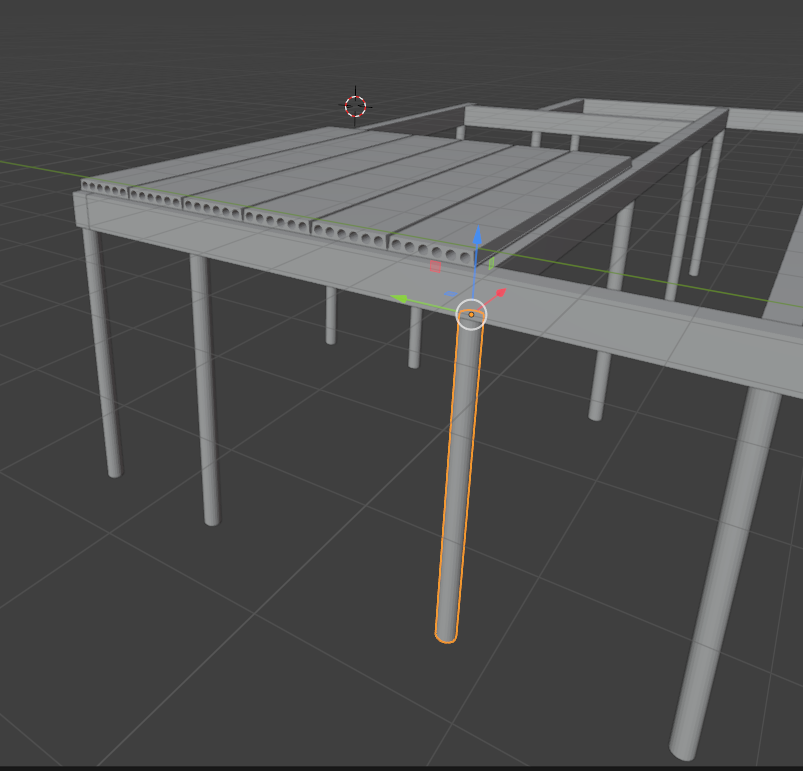
IfcBeams with a profile.
IfcPiles, made with Custom Mesh, as I couldn't assign a model/Annotation/PLAN_VIEW representation to an Extruded Profile. This was the prerequisite to make the symbol. As said before this seemed the best way as the symbol moves with the pile. For visibility (in a floor plan, not RCP) you can move representation up and down till you see it. To actually make the symbol you need to make it 2D and then extrude it upwards for a bit (eg. 30 mm), otherwise it won't show up.

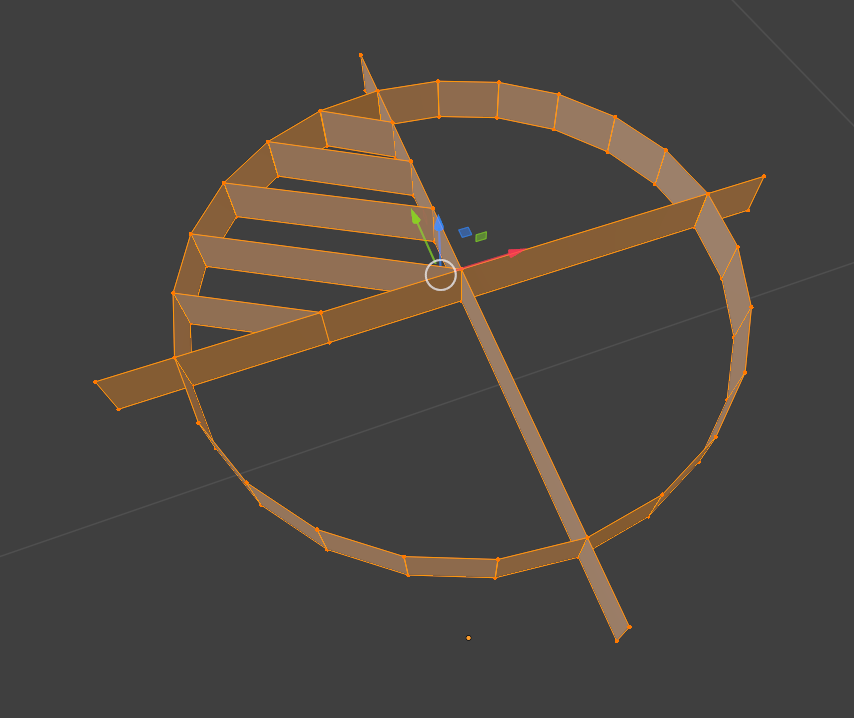
Normal 2D symbols made in symbol.svg by copying existing parts and putting in my needed shapes via this online svg editor.
2D symbols with text included are a bit different. While I don't think this is the permanent way, for now I made them by making the symbols, then placing a text annotation. Add the symbol to the text annotation via EPset_Annotation>Symbol [symbolname as in symbols.svg]. In svg its needed to then transform (translate) the symbol so that it is in the correct position in relatoin to the text. A question: Bonsai doesn't let me save 'default' text in the type. I want to put in {{Tag}} as default, is it possible another way?
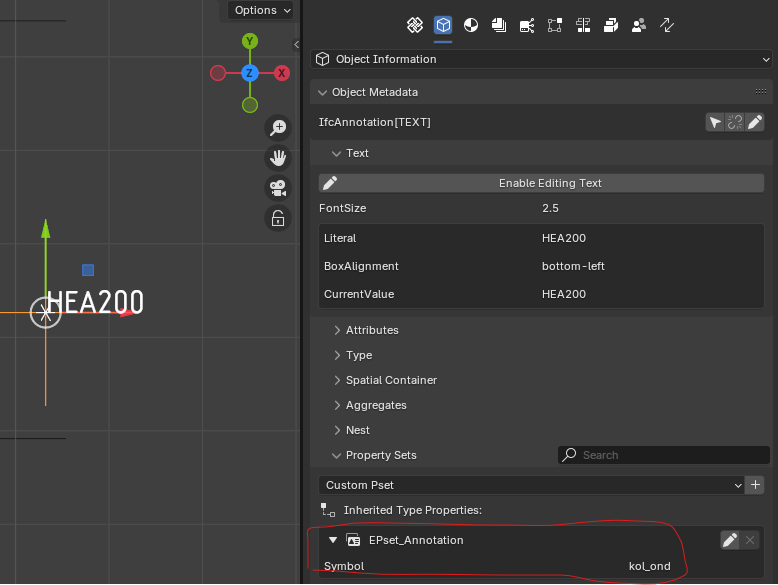

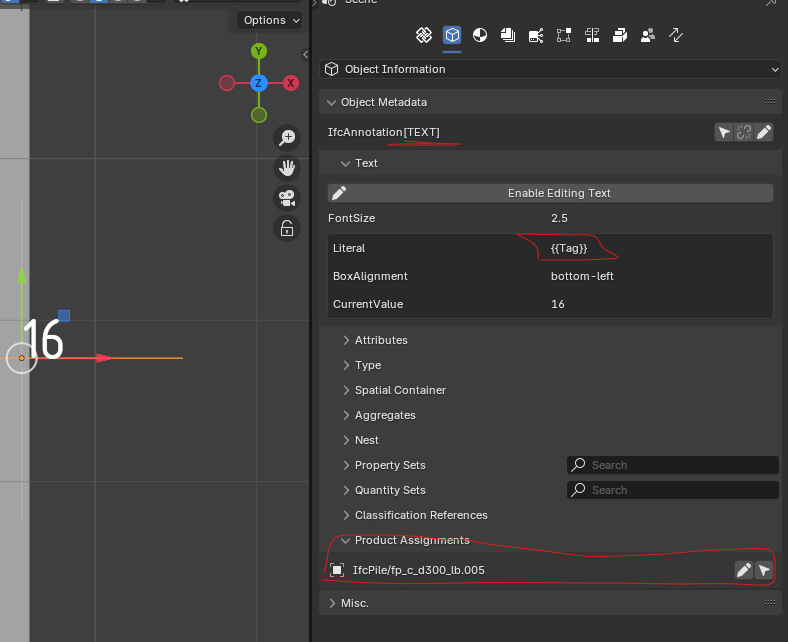
Numbering tags: just place a text annotation and put {{Tag}} in it, then pair it to an element via "Product Assignments". Question: is it possible to assign a Tag attribute (for numbering) to an annotation? It doesn't show up in attributes.
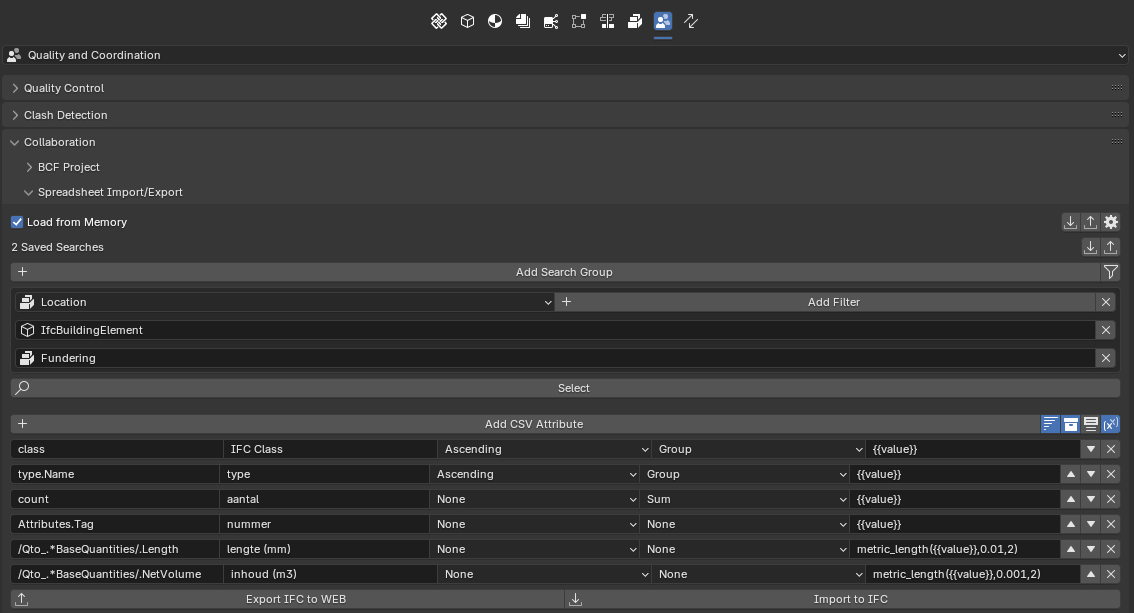
Create a schedule. A question: in this schedule I want to see the individual piles by their Tag number, so I put in Attributes.Tag. This doesn't work however, so maybe someone knows how to do that? @steverugi
Is it possible to automate tagging and numbering via an easy way I dont know of? numbering manually, creating the tags and assigning to each pile isn't exactly efficient ;)
The model and everything is in the zip. Thanks for reading and if there are suggestions or questions, let me know ;)
Hereby the zip.
Hi @jes_r
only use Tag not Attributes.Tag
OK I can check it properly over the weekend, cheers
@theoryshaw you are a legend, BHS Pepper backing track, fantastic
ha.. thanks.. just a random track from my favs playlist :)...
https://open.spotify.com/playlist/6L2H3HVKzqQcKYQenO81mn?si=bfcee5edf4944d5f
Just realized you can make grids show up if you add the Plan/Annotation/REFLECTED_CEILING_VIEW to the file
video: https://community.osarch.org/uploads/editor/43/u0o9c54wjz3y.mp4 (btw..this musician is from Australia, and is awesome!)
Added the Plan/Annotation/REFLECTED_CEILING_VIEW to the demo file by default: https://github.com/IfcOpenShell/IfcOpenShell/commit/8cec71731537ed22241de65ae50a890850b6fd21
...
Also, i think @Moult's been fixing those grid glitches!
I wanted to use the 'tag' attribute as well, but it might not be the best...
https://community.osarch.org/discussion/1428/what-is-the-equivalent-of-a-type-mark-in-revit
I see, but in the Ifc Documentation I found this:
https://standards.buildingsmart.org/IFC/RELEASE/IFC4/ADD2/HTML/link/ifcelement.htm
See upstream bug: https://github.com/buildingSMART/IFC4.3.x-development/issues/674