

Open data formats for 3d data registration / 3d scans / point clouds / photogrammetry
Update 2023-11-23
A constantly updated summary will be in this post: https://community.osarch.org/discussion/comment/18244/#Comment_18244
I need some advice on handling and specifying data formats for point cloud data. We don't really have anything on our wiki and it seems like the whole field is very fractured into many formats.
I'd like a discussion about which file formats are best for point cloud data to be handled by FLOSS. here's what I found with a cursory search on a topic I barely understood 15 minutes ago:
- E57 seems to be the prefered format for some importers
- PLY, then there is an importer to Blender PLY ( Point Cloud Visualizer https://blendermarket.com/products/pcv). For .pts / .ply. PTS seems to be "Leica Lidar scanners (.pts files)" look proprietary although it's ASCII and therefore very heavy, I guess it's accessably but still proprietary.
- PCD (Point Cloud Data) binary file format which Blender seems to like https://markhedleyjones.com/projects/blender-pcd-io
- PCL (Point Cloud Library), BSD license, can act as a container for PCD https://en.wikipedia.org/wiki/Point_Cloud_Library
- X3D which looks like it's quite new and has a large range of capabilities. It's Apache 2.0 https://en.wikipedia.org/wiki/X3D
- Open3D seems to also be used and includes color data. It's Apache-2.0 & MIT https://en.wikipedia.org/wiki/Open_3D_Engine
... so what should we have on our wiki? Of I would like our wiki to provide an overview and some recommendations
... and https://openpointcloudformats.org/docs/ seems to suggest that there are no formats... Our discussion: https://community.osarch.org/discussion/728/open-pointcloud-formats-petition
What's the name of the system where points also cary color data? Is that still regarded as "simply" point data, just with more information for each point?
What about the related field of photogrammetry? I think many scanners record using both methods at the same time...
- The only FLOSS workflow I know of (by @bitacovir ) described on our wiki for photogrammetry uses the Photogrammetric Compter Vison (PCV) https://u.osu.edu/pcvlab/ format https://wiki.osarch.org/index.php?title=Regard3D+Blender+FreeCAD_workflow I can't see ifPCV is an open format... at the same time saying that E57 is an industry open format (!)
So what do we know in our collective knowledge?
Some people who've discussed this in the past: @Hagaeus @Moult @bitacovir @Coen @magicalcloud_75 @JanF


Comments
In my experience e57 is widely used in the industry and I never had a problem obtaining it from scan people.
I suggest _cloudcompare _to handle the data conversion to ply becayse it seems to be the better supported format in blender (i might be wrong).
If you have to deal with large dataset _cloudcompare _can also reduce the number of points: blender is quite limited in the ammount of points it can handle. I bought Blender Point Cloud Visualizer and there is some development going on to support large dataset in 3.0.0.x alpha versions.
I agree that e57 is the biggest one. It is unfortunately a bit loose in the definitions so an E57 from one software may not be compatible with another. PTS, and the compressed PTX, is also widely used.
Both these are Structured point clouds, meaning they contain information of scanner positions, normals and which point belongs to what scan. It also typically contains the pano photo from the scanner. That makes it bigger, but also more useful as for filtering and such.
LAS and compressed LAZ is the biggest unstructured format. It only contains points with RGB and other scalar values like intensity.
CloudCompare and LAStools are the biggest open-source softwares. Meshlab can also handle some pointclouds, but is better for meshes.
CloudCompare can unfortunately not handle the panoramas, but it has a ton of plugins from all kind of sectors. It is the software that makes science possible.
A typical pointcloud contains coordinates (of course). These can be local or georeferenced. A lot of software can not handle the long coordinates of georeferenced clouds and either just crash, make rounding errors, or translate them closer to origo for internal handling.
If the scanner used a camera the cloud is coloured with an rgb value.
There are also most often an intensity value. The reflectivity of the taget makes a stronger or weaker return. Lowest intensity is often filtered as they are bounces off edges, through glass and other unwanted points.
There can also be a lot of other scalar values. Either from the scanner or calculated post scanning. Ex. elevation, segmentation, curvature.
The structured point clouds also contain scan position and photo as mentioned above. Structured is also called Gridded or Ordered.
For more Structure from Motion (SfM) software (photogrammetry) check MicMac, Meshroom and Open Drone Map ODM (runs on MicMac).
QGIS works well with point clouds but is focused on those at the larger scale. As of the previous release it has a number of built in processing algorithms for point cloud based on the Point Data Abstraction Library (PDAL https://pdal.io/en/2.6.0/ ). It primarily intakes LAS and LAZ formats and converts them to cloud optimized point clouds (COPC https://copc.io/ ). The point clouds can be displayed in plan, section, and 3D.
As of the latest release QGIS can also use Cesium 3d tiles. https://cesium.com/blog/2023/11/07/qgis-now-supports-3d-tiles/
Regarding photogrammetry:
https://community.osarch.org/discussion/231/alicevision-photogrammetric-computer-vision-framework
(I can't believe I forgot to add it to the wiki)
Regarding pointclouds:
I don't think there's a way to import e57 directly to Blender, Meshlab or Cloudcompare should mostly work. (As others have said, there are different flavours, depending on the scanner manufacturer)
My go to formats are e57 and ply. In terms of quality I don't think there is much difference. There might be slight differences in size on disk which can be a big point of contention since points cloud can get very heavy. Note e57 can store laser station data, so each station can be registered under its own sub point cloud and also store photography information, laser position, sensor information, time of acquistion, etc.
In CloudCompare you can also go into "Bubble View" which positions the viewport camera at the location of the sensore and your can look around the point cloud from there.
ply is more straightforward and can store point location, intensity and any number of scalar values. ply has a binary and ascii format. The pcv addon in Blender can load ply formats natively and e57 with the download of a third party python library (pye57 or pyMeshLab). Note that ply can also store mesh information (edges, polygons), not just point clouds. Blender has a native ply importer but it is nowhere near the performance of the PCV addon when treating point clouds.
e57 seems to be more widely accepted by other softs. I know Archicad can import it natively, not sure about ply. Revit only accepts point clouds from Recap, which in turn accepts e57, not sure about ply.
Any other proprietary or closed formats I don't use because at some point you'll be locked in a specific vendor ecosystem.
Lots of great comments and info! I knew I could count on ya'all
To summarize
Background knowledge
* A "structured" file would mean its position is not limited to xyz coordinates. Often refered to as Gridded or Ordered
* Data can include xyz, (return) intensity, (world) coordinates, colors, panorama images, elevation, segmentation, curvature, and scanner position
Suggested file format
* E57 can store the most data, including point station data & colors
* PLY also popular. ASCII or binary. Can also contain mesh
* PTS, and the compressed PTX, is also widely used. Structured point clouds and can contain panorama images
* LAS (binary) and LAZ (lossless compressed LAS) is the main unstructured format. It does not contain scan position or panorama photo data. It is an open data format. VLR is an optional extensions which allow inclusion of a greater data payload, the EVLRS extension allows an even greater payload. https://www.ogc.org/standard/las/ https://www.usgs.gov/ngp-standards-and-specifications/point-cloud-delivery-laz-format
Suggested software
* CloudCompare (can convert to PLY). Cannot handle panaroma photos. Extensive collection of plugins and supported formats including E57.
* Blender with the Point Cloud Visualizer Add-in can import ** but Blender is limited in the number of points it can handle compared to other software. Native PLY support is clunky. Third party libraries make E57 import possible (pye57 or pyMeshLab)
* LAStools (LGPL-2.1?) relies on my closed source components. Cross platform. Very few commits the last few years.
* Meshlab can also handle some pointclouds, but is better for meshes.
* QGIS is great, but designed for large datasets/scales. Internally (and for export) it uses COPC (an extension of LAS data). Also visualizes 3D tiles.
* A useful but non-free online solution for e57 and many related file formats is browser.usbim.com by ACCA Software. ACCA is a strong supporter of buildingsmart open standards like IFC. Registration required.
Questions
* What are my options for measurable data so I can measure a dimension of an object?
Corrections & comments?
2023-11-23: small corrections as per comments
Great summary! It's LAZ and not LAX though.
You can measure in all of these formats. Question is what you want to measure? Distance, distance in Z-axis, area, volume och the volume of mortar that needs replacing in a castle? https://www.historicenvironment.scot/about-us/news/new-innovative-technology-launched-to-help-care-for-scotland-s-traditional-buildings/
As always: great job Duncan!
To clear up a potential point of confusion:
LAS/LAZ/COPC can contain more than just XYZ data such as color etc but the position data is XYZ.
So maybe:
Not Sure about this line:
https://www.asprs.org/wp-content/uploads/2019/07/LAS_1_4_r15.pdf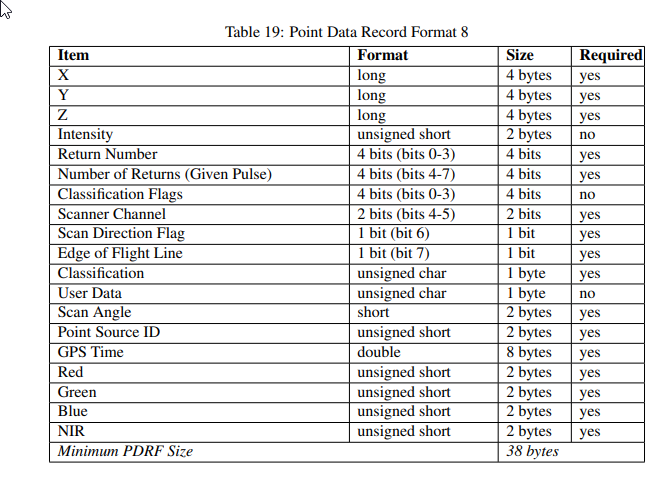
Thanks for the corrections, they are included in the summary
@Hagaeus can you clarify?
Are you sure? "All LAS files shall be delivered in compressed LAZ format" (https://www.usgs.gov/ngp-standards-and-specifications/point-cloud-delivery-laz-format)
What's LAX?
General clarification
* If the xyz origin is the station, then how is the vector of x & y defined?
* Is there a reasonably clear way to differentiate formats suited to building scale and formats suited to geographical / sites? It sounds like COPC is more for geography - but why?
* Measuring - I guess what I'm really asking is what software is useful for taking dimensions from the scan. For example the dimensions of a room or the placement of a fixture.
LAX is Los Angeles Airport ;)
Structured is the most commonly used word, but Ordered is also used. Trimble uses Gridded in their software and I am sure there are more words out there.
The scanner is not the origin. When you register the scans together (align them to each other) you set an origin and orientation that suits your project. Typically origin in the corner of a building and the walls following x and y axis.
Small sites like buildings are known as "vertical structures" and use a local coordinate system because calculating with the curvature of earth is really, really complicated and it doen't matter over short distances. These can have a transformation matrix of northings, eastings, scale to transform them back to geo coordinates if they were referenced at capture (see IFC4).
Projects like roads need to use geo coordinates because earth is round-ish and the distance between two points is different in a straight line and following the ground. Also factor in continental drift, landslides, the fact that earth is not a sphere and neither an ellipse and so on. That's why you want to avoid it if you can.
Do all these formats handle this in the same way? I guess in theory that a scan og a very large airport or similar project would actually capture the curvature in the xyz data? My questions is whether or not some formats are only relevant for either 'vertical' or 'horizontal' (?) scans? They are very different use cases and OSArch would normally reference other projects and avoid getting into the weeds of how to do geographical surveying.
I can't speak for all formats, but the ones I've used can handle all kinds of coordinates. What most can NOT do is have info on what system is used and at what time. That usually has to be provided separately.
When you are nearing a kilometer the difference come into play. I am no surveyor myself, but I need to know when to call one. As an architect you should never have to handle that, but leave it to the surveyor. But like you say, there are some large buildings and it is good to know the problem exists.
So if you scan a large area and only rely on the inclinometer of your scanner, there will be errors. You need to put Ground Control Points, GCP, with a GNSS and also possibly have control with a total station.